Figure 2-1 shows the production possibilities curve of an economy that produces bread and wine. The most inefficient point depicted is:.Figure 2-1 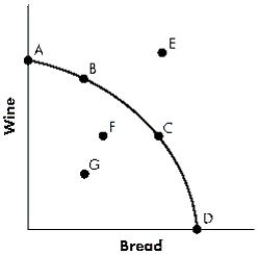
A) Point A.
B) Point C.
C) Point D.
D) Point G.
E) Point E.
Correct Answer:
Verified
Q64: Figure 2-2 shows the production possibilities curve
Q65: Economic efficiency is defined as:
A)the maximization of
Q66: If additional units of output could be
Q67: Which of the following distinguishes a "straight-line"
Q68: The production possibilities curve illustrates:
A)the minimum quantity
Q70: Which of the following scenarios would cause
Q71: A technological advancement that increases the productivity
Q72: Figure 2-2 shows the production possibilities curve
Q73: An economy's production possibilities curve is concave
Q74: Figure 2-2 shows the production possibilities curve
Unlock this Answer For Free Now!
View this answer and more for free by performing one of the following actions

Scan the QR code to install the App and get 2 free unlocks

Unlock quizzes for free by uploading documents