Figure 2-2 shows the production possibilities curve of an economy in the production of consumption goods and capital goods. A movement from Point ____ to Point ____ will result in an increase in the quantity of both capital and consumption goods produced in the economy.Figure 2-2 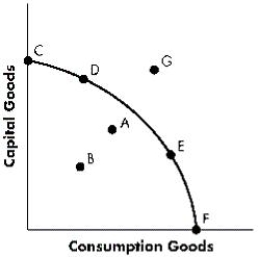
A) B; A
B) F; A
C) D; F
D) F; D
E) A; G
Correct Answer:
Verified
Q67: Which of the following distinguishes a "straight-line"
Q68: The production possibilities curve illustrates:
A)the minimum quantity
Q69: Figure 2-1 shows the production possibilities curve
Q70: Which of the following scenarios would cause
Q71: A technological advancement that increases the productivity
Q73: An economy's production possibilities curve is concave
Q74: Figure 2-2 shows the production possibilities curve
Q75: Economic growth can be illustrated by:
A)a movement
Q76: Figure 2-1 shows the production possibilities curve
Q77: Figure 2-1 shows the production possibilities curve
Unlock this Answer For Free Now!
View this answer and more for free by performing one of the following actions

Scan the QR code to install the App and get 2 free unlocks

Unlock quizzes for free by uploading documents