Figure 2-1 shows the production possibilities curve of an economy that produces bread and wine. Along the production possibilities curve, _____ is an economically efficient point of production.Figure 2-1 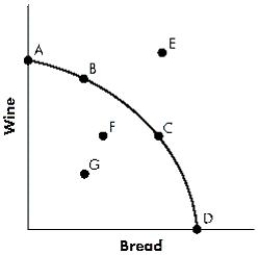
A) Point G
B) Point F
C) Point E
D) Point B
E) the origin
Correct Answer:
Verified
Q72: Figure 2-2 shows the production possibilities curve
Q73: An economy's production possibilities curve is concave
Q74: Figure 2-2 shows the production possibilities curve
Q75: Economic growth can be illustrated by:
A)a movement
Q76: Figure 2-1 shows the production possibilities curve
Q78: When resources are used efficiently, a country
Q79: Figure 2-1 shows the production possibilities curve
Q80: Figure 2-3 shows the production possibilities curve
Q81: Farmer Fred could grow wheat and barley.
Q82: Which of the following concepts explains how
Unlock this Answer For Free Now!
View this answer and more for free by performing one of the following actions

Scan the QR code to install the App and get 2 free unlocks

Unlock quizzes for free by uploading documents