Figure 2-1 shows the production possibilities curve of an economy that produces bread and wine. A movement from Point B to Point C:Figure 2-1 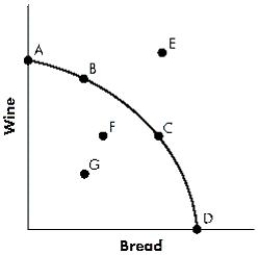
A) involves sacrificing bread in order to produce a greater quantity of wine.
B) involves sacrificing wine in order to produce a greater quantity of bread.
C) involves no sacrifice, as the opportunity cost of production is zero everywhere along the production possibilities curve.
D) will increase the level of unemployment in the economy.
E) will decrease the level of unemployment in the economy.
Correct Answer:
Verified
Q71: A technological advancement that increases the productivity
Q72: Figure 2-2 shows the production possibilities curve
Q73: An economy's production possibilities curve is concave
Q74: Figure 2-2 shows the production possibilities curve
Q75: Economic growth can be illustrated by:
A)a movement
Q77: Figure 2-1 shows the production possibilities curve
Q78: When resources are used efficiently, a country
Q79: Figure 2-1 shows the production possibilities curve
Q80: Figure 2-3 shows the production possibilities curve
Q81: Farmer Fred could grow wheat and barley.
Unlock this Answer For Free Now!
View this answer and more for free by performing one of the following actions

Scan the QR code to install the App and get 2 free unlocks

Unlock quizzes for free by uploading documents