Figure 3-2 shows the shifts in the demand curve for a good. A change from Point A to Point C represents a(n) :Figure 3-2 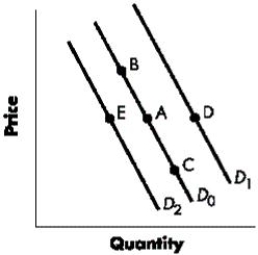
A) increase in demand.
B) decrease in demand.
C) decrease in quantity demanded.
D) increase in the price of the good.
E) increase in the price of the good
Correct Answer:
Verified
Q37: When quantity demanded decreases at every possible
Q38: Table 3-1 shows the demand schedules for
Q39: Table 3-1 shows the demand schedules for
Q40: Which of the following would cause the
Q41: Figure 3-2 shows the shifts in the
Q43: Which of the following is a difference
Q44: Figure 3-3 shows shifts in the supply
Q45: A supply curve illustrates a(n) _ relationship
Q46: Table 3-2 shows a market of mid-sized
Q47: Along the supply curve of a good,
Unlock this Answer For Free Now!
View this answer and more for free by performing one of the following actions

Scan the QR code to install the App and get 2 free unlocks

Unlock quizzes for free by uploading documents