Figure 3-2 shows the shifts in the demand curve for a good. A change from Point A to Point E represents a(n) :Figure 3-2 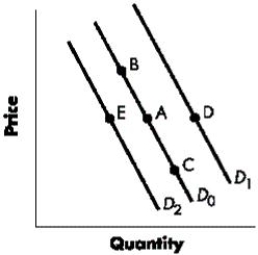
A) increase in demand.
B) decrease in demand
C) decrease in quantity demanded
D) increase in quantity demanded
E) increase in the price of the good.
Correct Answer:
Verified
Q36: Two goods are substitutes when a decrease
Q37: When quantity demanded decreases at every possible
Q38: Table 3-1 shows the demand schedules for
Q39: Table 3-1 shows the demand schedules for
Q40: Which of the following would cause the
Q42: Figure 3-2 shows the shifts in the
Q43: Which of the following is a difference
Q44: Figure 3-3 shows shifts in the supply
Q45: A supply curve illustrates a(n) _ relationship
Q46: Table 3-2 shows a market of mid-sized
Unlock this Answer For Free Now!
View this answer and more for free by performing one of the following actions

Scan the QR code to install the App and get 2 free unlocks

Unlock quizzes for free by uploading documents