Figure 3-3 shows shifts in the supply curve of a good. A change from Point A to Point D represents a(n) ;Figure 3-3 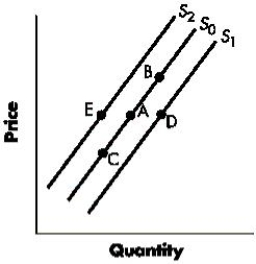
A) increase in the supply of the good.
B) decrease in the supply of the good
C) increase in the quantity supplied of the good
D) decrease in the quantity supplied of the good.
E) decrease in the price of the good
Correct Answer:
Verified
Q48: A decrease in the number of sellers
Q49: Figure 3-2 shows the shifts in the
Q50: Figure 3-3 shows shifts in the supply
Q51: The market supply schedule reflects the total
Q52: Figure 3-2 shows the shifts in the
Q54: Which of the following is a difference
Q55: A decrease in the price of a
Q56: Figure 3-3 shows shifts in the supply
Q57: Correct. In the given graph, a shift
Q58: As a result of an increase in
Unlock this Answer For Free Now!
View this answer and more for free by performing one of the following actions

Scan the QR code to install the App and get 2 free unlocks

Unlock quizzes for free by uploading documents