Figure 3-3 shows shifts in the supply curve of a good. A change from Point A to Point E represents a(n) :Figure 3-3 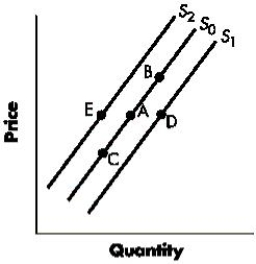
A) increase in supply
B) decrease in supply.
C) increase in quantity supplied.
D) decrease in quantity supplied
E) increase in the price of the good.
Correct Answer:
Verified
Q45: A supply curve illustrates a(n) _ relationship
Q46: Table 3-2 shows a market of mid-sized
Q47: Along the supply curve of a good,
Q48: A decrease in the number of sellers
Q49: Figure 3-2 shows the shifts in the
Q51: The market supply schedule reflects the total
Q52: Figure 3-2 shows the shifts in the
Q53: Figure 3-3 shows shifts in the supply
Q54: Which of the following is a difference
Q55: A decrease in the price of a
Unlock this Answer For Free Now!
View this answer and more for free by performing one of the following actions

Scan the QR code to install the App and get 2 free unlocks

Unlock quizzes for free by uploading documents