The figure below shows the long-run average cost curve for a firm. Based on the figure, Point A shows _____.Figure 6-5 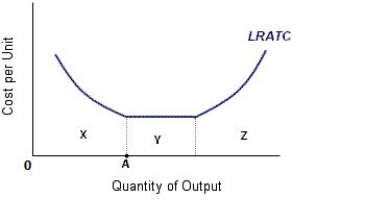
A) the level of output at which the firm breaks even
B) the level of output at which consumers attain maximum utility
C) the level of output at which the firm attains its minimum efficient scale
D) the level of output at which the firm earns zero economic profit
E) the level of output at which the marginal utility from consumption begins to diminish
Correct Answer:
Verified
Q89: The figure below shows the long-run average
Q90: The figure below shows the long-run average
Q91: The figure below shows the long-run average
Q92: Constant returns to scale indicate that a
Q93: Explain why some costs are considered to
Q94: Where does the marginal cost curve intersect
Q95: Which of the following is true in
Q96: When economies of scale exist, an increase
Q97: When there are economies of scale in
Q99: A firm's total product of labor curve
Unlock this Answer For Free Now!
View this answer and more for free by performing one of the following actions

Scan the QR code to install the App and get 2 free unlocks

Unlock quizzes for free by uploading documents