The figure below shows the revenue and cost curves for a profit-maximizing monopolist. Based on the figure, the region bounded by FAGB represents _____.FIGURE 8-2 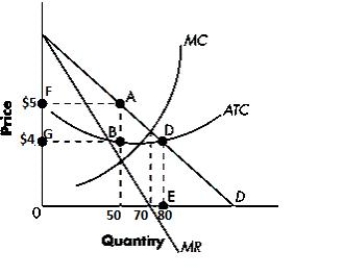
A) total costs.
B) total losses.
C) total profits.
D) total consumer surplus.
E) total producer's surplus.
Correct Answer:
Verified
Q67: The figure below shows the revenue and
Q68: Which of the following is true of
Q69: Which of the following is true about
Q70: The figure below shows the revenue and
Q71: Which of the following statements is true?
A)Both
Q73: The figure below shows the revenue and
Q74: The figure below shows the revenue and
Q75: The figure below shows the revenue and
Q76: Which of the following is not true?
A)The
Q77: The figure below shows the revenue and
Unlock this Answer For Free Now!
View this answer and more for free by performing one of the following actions

Scan the QR code to install the App and get 2 free unlocks

Unlock quizzes for free by uploading documents