The figure below shows the revenue and cost curves for a profit-maximizing monopolist. Based on the figure, the welfare loss due to monopoly pricing and output practices is represented by the area _____.FIGURE 8-6 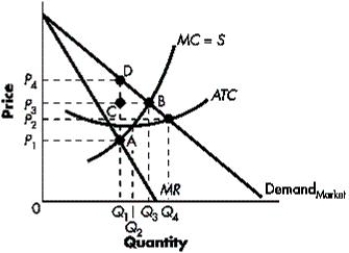
A) ADB
B) DCB
C) ACB
D) DAP1P4
E) DP4P3C
Correct Answer:
Verified
Q69: Which of the following is true about
Q70: The figure below shows the revenue and
Q71: Which of the following statements is true?
A)Both
Q72: The figure below shows the revenue and
Q73: The figure below shows the revenue and
Q75: The figure below shows the revenue and
Q76: Which of the following is not true?
A)The
Q77: The figure below shows the revenue and
Q78: The figure below shows the revenue and
Q79: The aim of antitrust policy is to:
A)provide
Unlock this Answer For Free Now!
View this answer and more for free by performing one of the following actions

Scan the QR code to install the App and get 2 free unlocks

Unlock quizzes for free by uploading documents