The following graphs show two firms operating in a monopolistically competitive market. The firm illustrated in Graph A will experience a _____ at a quantity _____.Figure 9.2: 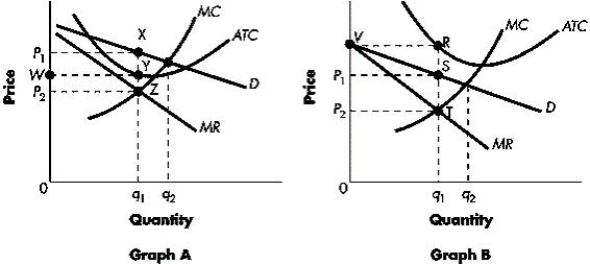
A) loss; of q1
B) loss; of q2
C) profit; of q1
D) profit; of q2
E) profit; between q1 and q2
Correct Answer:
Verified
Q55: When a firm's demand curve is tangent
Q56: In the long run, a profit-maximizing, monopolistically
Q57: If the pharmaceutical industry is monopolistically competitive,
Q58: The following graph shows a firm producing
Q59: The following graph shows a firm producing
Q61: Which of the following is a reason
Q62: For a time, either R. J. Reynolds
Q63: The equilibrium price and quantity for a
Q64: During the past 20 years, Marzi Corp.,
Q65: Which of the following is true of
Unlock this Answer For Free Now!
View this answer and more for free by performing one of the following actions

Scan the QR code to install the App and get 2 free unlocks

Unlock quizzes for free by uploading documents