The following graph shows a firm producing jeans in a monopolistically competitive market. The firm faces a downward-sloping, linear demand curve, D. The marginal revenue curve of the firm is shown by MR. AC and MC are the average total cost and marginal cost curves of the firm. Which of the following is likely to true of the firm at the profit-maximizing point?Figure 9.3: 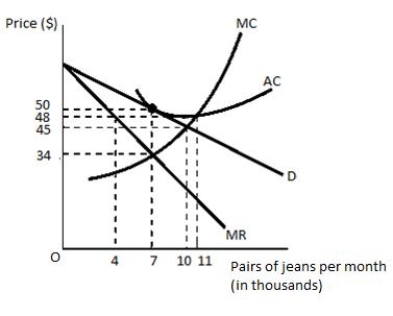
A) The firm will charge $50 per pair of jeans.
B) The firm will charge $48 per pair of jeans.
C) The firm will charge $34 per pair of jeans.
D) The firm will produce 11,000 pairs of jeans each month.
E) The firm will produce 10,000 pairs of jeans each month.
Correct Answer:
Verified
Q54: When a monopolistically competitive firm is at
Q55: When a firm's demand curve is tangent
Q56: In the long run, a profit-maximizing, monopolistically
Q57: If the pharmaceutical industry is monopolistically competitive,
Q58: The following graph shows a firm producing
Q60: The following graphs show two firms operating
Q61: Which of the following is a reason
Q62: For a time, either R. J. Reynolds
Q63: The equilibrium price and quantity for a
Q64: During the past 20 years, Marzi Corp.,
Unlock this Answer For Free Now!
View this answer and more for free by performing one of the following actions

Scan the QR code to install the App and get 2 free unlocks

Unlock quizzes for free by uploading documents