Figure 10-1 shows shifts in the market labor supply curves. Which of the following situations is illustrated by Case A?Figure 10-1 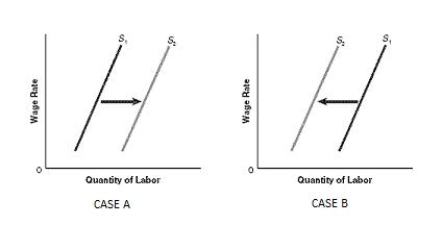
A) Increases in income from sources other than employment
B) Deteriorating job amenities
C) People becoming willing to work fewer hours at a given wage
D) People becoming willing to work fewer hours at a given wage.
E) Many workers leaving the labor force
Correct Answer:
Verified
Q36: When labor is a firm's only variable
Q37: The wage of a unit of labor
Q38: Table 10-1 shows the output produced by
Q39: An individual firm in a perfectly competitive
Q40: The marginal product of labor measures:
A)the total
Q42: Which of the following will shift an
Q43: Figure 10-1 shows shifts in the market
Q44: According to Harvard economists Richard Freeman and
Q45: An increase in workplace amenities, such as
Q46: Labor unions:
A)decrease employment in the nonunion sector.
B)increase
Unlock this Answer For Free Now!
View this answer and more for free by performing one of the following actions

Scan the QR code to install the App and get 2 free unlocks

Unlock quizzes for free by uploading documents