Figure 10-2 shows the impact of labor unions on a labor market. In the figure, when unions successfully increase the wages of its members, the supply curve in the union sector shifts from _____ and _____ workers lose their jobs as a result.Figure 10-2 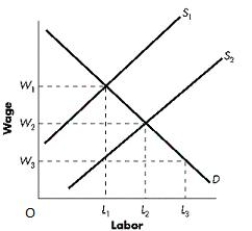
A) S1 to S2; L3 ─ L1
B) S2 to S1; L3 ─ L1
C) S1 to S2; L2 ─ L1
D) S2 to S1; L2 ─ L1
E) S2 to S1; L3 ─ L1 .
Correct Answer:
Verified
Q42: Which of the following will shift an
Q43: Figure 10-1 shows shifts in the market
Q44: According to Harvard economists Richard Freeman and
Q45: An increase in workplace amenities, such as
Q46: Labor unions:
A)decrease employment in the nonunion sector.
B)increase
Q48: Which of the following is likely to
Q49: Which of the following is likely to
Q50: Labor unions:
A)have no influence over wages.
B)can influence
Q51: At a wage below the equilibrium level,
Q52: If the demand for software engineers _
Unlock this Answer For Free Now!
View this answer and more for free by performing one of the following actions

Scan the QR code to install the App and get 2 free unlocks

Unlock quizzes for free by uploading documents