Use the following to answer questions : 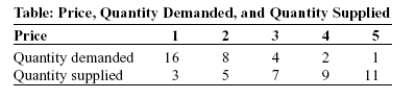
-(Table: Price, Quantity Demanded, and Quantity Supplied) Look at the table Price, Quantity Demanded, and Quantity Supplied. The slope of the line representing the relation between price on the vertical axis and quantity supplied on the horizontal axis is:
A) equal to 1/2.
B) equal to 1.
C) equal to 2.
D) different at different points on the line.
Correct Answer:
Verified
Q47: Use the following to answer questions :
Figure:
Q48: Use the following to answer questions :
Figure:
Q49: Use the following to answer questions :
Figure:
Q51: If a supply curve is represented by
Q52: Use the following to answer questions :
Figure:
Q53: A positive relationship between swimsuits purchased and
Q53: Use the following to answer questions :
Q54: Professor Macro wants to use a numerical
Q55: Use the following to answer questions :
Figure:
Q57: Taylor sees a bar graph showing the
Unlock this Answer For Free Now!
View this answer and more for free by performing one of the following actions

Scan the QR code to install the App and get 2 free unlocks

Unlock quizzes for free by uploading documents