Use the following to answer questions :
Figure: Seasonally Adjusted Unemployment Rate 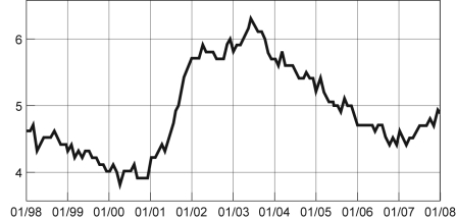
-(Figure: Seasonally Adjusted Unemployment Rate) Look at the figure Seasonally Adjusted Unemployment Rate. The distance between each labeled point on the horizontal axis is one year. Unemployment was ______ between 1/2001 and 1/2003 and ______ between 1/2007 and 1/2008.
A) increasing; decreasing
B) increasing; increasing
C) decreasing; increasing
D) decreasing; decreasing
Correct Answer:
Verified
Q43: Use the following to answer question:
Q47: Use the following to answer questions :
Figure:
Q48: Use the following to answer questions :
Figure:
Q49: Use the following to answer questions :
Figure:
Q50: Use the following to answer questions :
Q51: If a supply curve is represented by
Q53: Use the following to answer questions :
Q54: Professor Macro wants to use a numerical
Q55: Use the following to answer questions :
Figure:
Q57: Use the following to answer questions:
Figure: Unemployment
Unlock this Answer For Free Now!
View this answer and more for free by performing one of the following actions

Scan the QR code to install the App and get 2 free unlocks

Unlock quizzes for free by uploading documents