Use the following to answer questions:
Figure: Unemployment Rate over Time 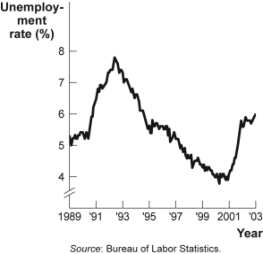
-(Figure: Unemployment Rate over Time) Look at the figure Unemployment Rate over Time. In the time-series graph, as we move from 1993 to 1995, we see that the unemployment rate has _____ from approximately _____ to approximately _____.
A) decreased; 5%; 4%
B) increased; 5.3%; 7.3%
C) decreased; 7%; 5.5%
D) increased; 4%; 6.3%
Correct Answer:
Verified
Q43: Use the following to answer question:
Q46: A scatter diagram shows:
A)how far apart dependent
Q52: Use the following to answer questions :
Figure:
Q53: Use the following to answer questions :
Q54: Professor Macro wants to use a numerical
Q55: Use the following to answer questions :
Figure:
Q58: Use the following to answer question :
Figure:
Q59: Use the following to answer questions :
Figure:
Q60: Use the following to answer questions :
Figure:
Q62: Use the following to answer questions :
Figure:
Unlock this Answer For Free Now!
View this answer and more for free by performing one of the following actions

Scan the QR code to install the App and get 2 free unlocks

Unlock quizzes for free by uploading documents