Figure: Supply and Demand 2 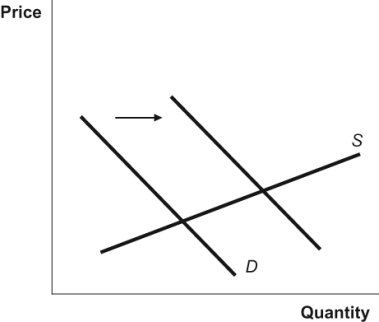 What happens as a result of the change in demand in the diagram?
A) a decrease in both the equilibrium price and the equilibrium quantity
B) an increase in both the equilibrium price and the equilibrium quantity
C) an increase in the equilibrium price and a decrease in the equilibrium quantity
D) a decrease in the equilibrium price and an increase in the equilibrium quantity
Correct Answer:
Verified
Q147: Figure: Demand Shift Q148: When the price of a good decreases: Q149: When supply decreases there is a _ Q150: If market demand decreases: Q151: Higher gasoline prices have led to a Q153: After a hurricane in Florida destroys half Q154: If market supply increases: Q155: When demand increases there is a _ Q156: Following the release of a new study Q157: If supply decreases, ceteris paribus, the quantity![]()
A)
A) equilibrium price and
A) equilibrium price and
Unlock this Answer For Free Now!
View this answer and more for free by performing one of the following actions

Scan the QR code to install the App and get 2 free unlocks

Unlock quizzes for free by uploading documents