Figure: Demand Shift 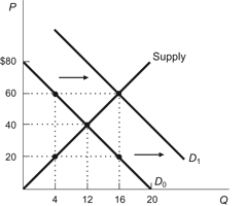 In the figure, the demand curve shifted from D0 to D1. To describe this movement, we would say that:
A) demand increased, which caused an increase in supply.
B) quantity demanded increased, which caused an increase in supply.
C) demand increased, which caused an increase in quantity supplied.
D) quantity demanded increased, which caused an increase in quantity supplied.
Correct Answer:
Verified
Q142: Technological advances have increased the supply of
Q143: Figure: Supply and Demand 3 
Q144: If equilibrium price increases while equilibrium quantity
Q145: If demand decreases, ceteris paribus, the quantity
Unlock this Answer For Free Now!
View this answer and more for free by performing one of the following actions

Scan the QR code to install the App and get 2 free unlocks

Unlock quizzes for free by uploading documents