Which graph portrays the change in number of molecules activated at each successive step in a signal transduction pathway?
A) 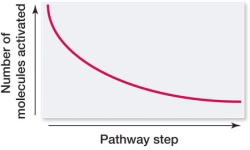
B) 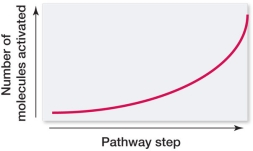
C) 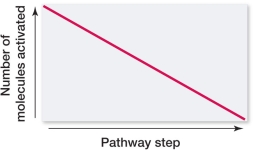
D) 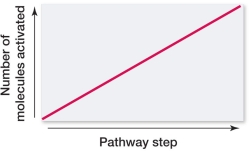
E) 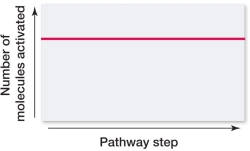
Correct Answer:
Verified
Q39: Which statement about cell signaling is false?
A)
Q40: Refer to the figure below. 
Q41: Three second messengers involved in penile erections
Q42: A benefit of the many steps involved
Q43: Refer to the figure below.
Q45: Vitamin D is a relatively small, lipid-soluble
Q46: The hydrolysis of phosphatidyl inositol-bisphosphate (PIP2) results
Q47: How does a protein kinase cascade amplify
Q48: Inositol trisphosphate (IP3) is released into the
Q49: The receptor for estrogen is
A) an ion
Unlock this Answer For Free Now!
View this answer and more for free by performing one of the following actions

Scan the QR code to install the App and get 2 free unlocks

Unlock quizzes for free by uploading documents