Which graph shows changes in the rate of an enzyme-catalyzed reaction as substrate concentration is varied?
A) 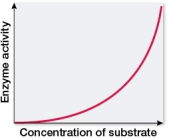
B) 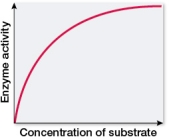
C) 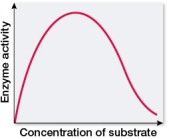
D) 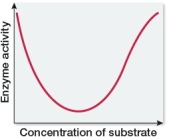
E) 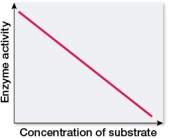
Correct Answer:
Verified
Q62: Refer to the expression below. 
Q63: In the presence of alcohol dehydrogenase, the
Q64: Enzymatic reactions can become saturated as substrate
Q65: Many enzymes require small nonprotein molecules for
Q66: In order to determine whether a reaction
Q68: You observe an enzymatic reaction that exhibits
Q69: Refer to the figure below.
Q70: Competitive inhibitors of enzymes work by
A) fitting
Q71: A noncompetitive inhibitor hinders binding of
Q72: The addition of the competitive inhibitor
Unlock this Answer For Free Now!
View this answer and more for free by performing one of the following actions

Scan the QR code to install the App and get 2 free unlocks

Unlock quizzes for free by uploading documents