The graph represents data collected by researchers interested in observing how diet affects cell metabolism.In the investigation, mice were grouped into control (C) and experimental (E) groups according to diet. 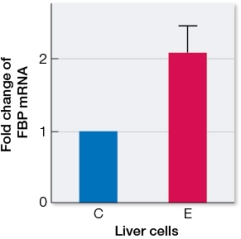 Control mice were fed normal mouse chow that has a mix of carbohydrate, protein, and fat.Experimental mice were fed chow made up of equal parts of protein and fat, with very little carbohydrate.After 8 weeks, samples of liver tissue were analyzed in various ways.In one assay, the expression of mRNA transcripts of the gene for fructose 1,6-bisphosphatase (FBP mRNA) was quantified.FBP is important in the gluconeogenesis pathway and catalyzes the conversion of fructose 1,6-bisphosphate to fructose 6-phosphate.The graph represents the results of this analysis.Explain what the data indicate about metabolic regulation in the liver when intake of carbohydrates is very low.
Correct Answer:
Verified
View Answer
Unlock this answer now
Get Access to more Verified Answers free of charge
Q126: Energy production occurs in different locations in
Q127: Which statement about metabolic pathways is incorrect?
A)
Q128: ATP molecules are important in metabolism because
Q129: Refer to the diagram below, showing allosteric
Q130: Refer to the diagram below. 
Q132: Construct a graph to show how the
Q133: What is the net free energy captured
Q134: Cellular respiration refers to the metabolic process
Q135: Construct a diagram to explain how the
Q136: Refer to the diagram below, showing allosteric
Unlock this Answer For Free Now!
View this answer and more for free by performing one of the following actions

Scan the QR code to install the App and get 2 free unlocks

Unlock quizzes for free by uploading documents