Refer to the figure showing the steps used in microarray analysis to detect differences in expression between tumor tissue and normal tissue.The spots in the bottom panel represent individual genes for patients who have good prognoses (left) as well as for patients who have poor ones (right).The colors of those spots represent levels of expression: red = high expression, yellow = intermediate expression, green = low expression. 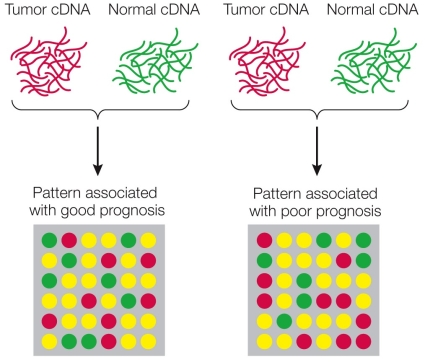 Look at the lowest, right-most gene in both patterns.Does expression of this gene correlate with the prognoses? Explain your answer.
Correct Answer:
Verified
View Answer
Unlock this answer now
Get Access to more Verified Answers free of charge
Q122: Refer to the table showing results from
Q123: Refer to the figure showing how genomic
Q124: Refer to the table showing results from
Q125: In Cohen and Boyer's pioneering studies of
Q126: Which would be considered recombinant DNA?
A) A
Q128: Refer to the figure showing an experiment
Q129: Refer to the table showing results from
Q130: Refer to the table showing results from
Q131: Refer to the figure showing the steps
Q132: Which sequence is least likely to be
Unlock this Answer For Free Now!
View this answer and more for free by performing one of the following actions

Scan the QR code to install the App and get 2 free unlocks

Unlock quizzes for free by uploading documents