Refer to the graph showing a person's immune response, first to a vaccination, and later to exposure to the pathogen that the vaccine targeted.Time is represented on the x-axis, but the scale is different for each subdivision. 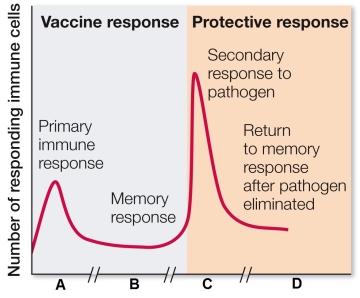 If the graph shown represents a time course following a person's vaccination against measles, which is an accurate estimate of times labeled A-D?
A) A must be months; C must be weeks.
B) A must be weeks; B could be days to years.
C) A must be days; D must be years.
D) B must be months; D must be years.
E) C must be months; D must be years.
Correct Answer:
Verified
Q158: Which characterizes fever?
A) It is controlled by
Q159: Which statement is true?
A) The spleen, thymus,
Q160: Which characterizes lysozyme?
A) It is produced in
Q161: Which statement about memory cells is true?
A)
Q162: Which aspect of the adaptive immune system
Q164: Which statement is true?
A) The humoral immune
Q165: Which characterizes antigenic determinants?
A) Specific regions on
Q166: Cytotoxic T cells
A) activate B lymphocytes.
B) can
Q167: According to the clonal selection theory,
A) an
Q168: The fact that B cells and T
Unlock this Answer For Free Now!
View this answer and more for free by performing one of the following actions

Scan the QR code to install the App and get 2 free unlocks

Unlock quizzes for free by uploading documents