The relationship between two quantities X and Y is examined,and the association is shown in the scatterplot below. 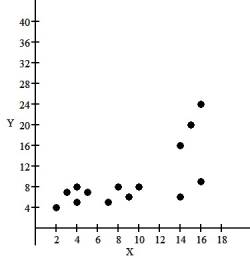 Should you re-express these data before trying to fit a model? Explain.
A) Data should be re-expressed.Scatterplot shows upward curvature and increasing scatter as X increases.
B) Data should be re-expressed.Scatterplot shows linear relationship and uniform scatter.
C) Data does not need to be re-expressed.Scatterplot shows upward curvature and increasing scatter as X increases.
D) Data should be re-expressed.Scatterplot shows linear relationship.
E) Data does not need to be re-expressed.Scatterplot shows linear relationship.
Correct Answer:
Verified
Q65: Data collected from students in Statistics
Q66: A clothes shop owner tries to
Q67: A university radio station has been
Q68: An economist noticed that nations with more
Q69: The relationship between two quantities X
Q71: A study shows that the amount of
Q72: A psychology graduate student is studying
Q73: A reporter studied the causes of a
Q74: The consumer price index (CPI)is a
Q75: The paired data below consist of
Unlock this Answer For Free Now!
View this answer and more for free by performing one of the following actions

Scan the QR code to install the App and get 2 free unlocks

Unlock quizzes for free by uploading documents