Solved

A University Radio Station Has Been Airing a Public Service

Question 67

Essay

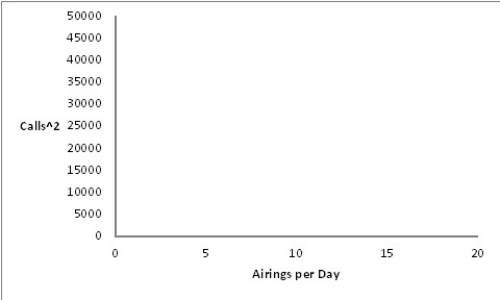
A university radio station has been airing a public service announcement (PSA)that gives a telephone number students can call to get information on upcoming campus events.In order to determine the optimal number of times per day to run the PSA,the station has been counting the number of calls generated each day as a function of the number of times the PSA was aired.The results of the experiment are summarized in the table below.  number ofnumber of number of number of  airingscalls per airings  cakks per Per dat dat per day day159914525810157380111844911218559813190613414186713215197814716209\begin{array}{|l|l|l|l|}\hline \text { number of}&\text {number of }&\text {number of }&\text {number of }\\\text { airings}&\text {calls per }&\text {airings }&\text { cakks per}\\\text { Per dat}&\text { dat}&\text { per day}&\text { day}\\\hline 1 & 59 & 9 & 145 \\\hline 2 & 58 & 10 & 157 \\\hline 3 & 80 & 11 & 184 \\\hline 4 & 91 & 12 & 185 \\\hline 5 & 98 & 13 & 190 \\\hline 6 & 134 & 14 & 186 \\\hline 7 & 132 & 15 & 197 \\\hline 8 & 147 & 16 & 209\\\hline\end{array} Re-express the data by squaring the number of calls per day,then plot the re-expressed data as a scatterplot.  A university radio station has been airing a public service announcement (PSA)that gives a telephone number students can call to get information on upcoming campus events.In order to determine the optimal number of times per day to run the PSA,the station has been counting the number of calls generated each day as a function of the number of times the PSA was aired.The results of the experiment are summarized in the table below.  \begin{array}{|l|l|l|l|} \hline \text { number of}&\text {number of }&\text {number of }&\text {number of }\\ \text { airings}&\text {calls per }&\text {airings }&\text { cakks per}\\ \text { Per dat}&\text { dat}&\text { per day}&\text { day}\\ \hline 1 & 59 & 9 & 145 \\ \hline 2 & 58 & 10 & 157 \\ \hline 3 & 80 & 11 & 184 \\ \hline 4 & 91 & 12 & 185 \\ \hline 5 & 98 & 13 & 190 \\ \hline 6 & 134 & 14 & 186 \\ \hline 7 & 132 & 15 & 197 \\ \hline 8 & 147 & 16 & 209\\\hline \end{array}  Re-express the data by squaring the number of calls per day,then plot the re-expressed data as a scatterplot.
Correct Answer:

verifed

Verified

Unlock this answer now
Get Access to more Verified Answers free of charge

Related Questions

Unlock this Answer For Free Now!

View this answer and more for free by performing one of the following actions

qr-code

Scan the QR code to install the App and get 2 free unlocks

upload documents

Unlock quizzes for free by uploading documents