The Centers for Disease Control in the U Which of the Following Displays Is/are Appropriate to Describe the Death
The Centers for Disease Control in the U.S.A.lists causes of death for individual states in 2002.The mortality data for the five leading causes of death for one state is given. Which of the following displays is/are appropriate to describe the data for all causes of death? (More than one display may be appropriate.)
I 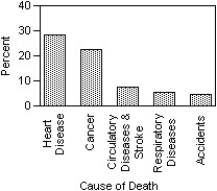
II 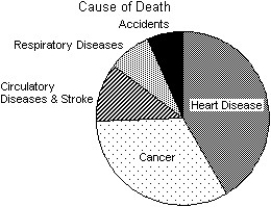
III 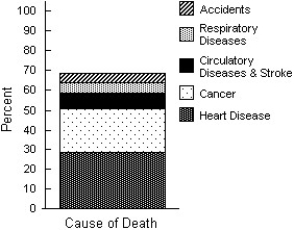
A) I,II
B) I
C) I,III
D) I,II,III
E) None of these displays are appropriate.
Correct Answer:
Verified
Q13: A newspaper surveyed its subscribers as
Q14: The Centers for Disease Control in
Q15: Statistics Canada gives the following mortality
Q16: The focus of a recent survey
Q17: A prediction of the number of
Q19: Students in a Political Science course
Q20: Of the 1470 applicants to a college
Q21: Students in a political science course
Q22: The focus of a recent survey
Q23: Statistics Canada gives the following mortality
Unlock this Answer For Free Now!
View this answer and more for free by performing one of the following actions

Scan the QR code to install the App and get 2 free unlocks

Unlock quizzes for free by uploading documents