Students in a Political Science course were asked to describe their politics as "Liberal","Moderate",or "Conservative." Here are the results: Which graphical display shows the marginal distribution of politics in the class?
I 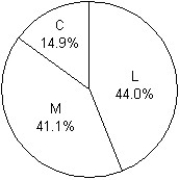
II 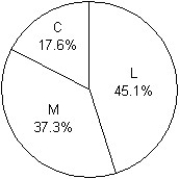
III 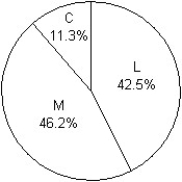
A) III
B) II
C) I
D) I,II,III
E) None of these displays show the marginal distribution of politics in the class.
Correct Answer:
Verified
Q14: The Centers for Disease Control in
Q15: Statistics Canada gives the following mortality
Q16: The focus of a recent survey
Q17: A prediction of the number of
Q18: The Centers for Disease Control in
Q20: Of the 1470 applicants to a college
Q21: Students in a political science course
Q22: The focus of a recent survey
Q23: Statistics Canada gives the following mortality
Q24: A survey of automobiles parked in
Unlock this Answer For Free Now!
View this answer and more for free by performing one of the following actions

Scan the QR code to install the App and get 2 free unlocks

Unlock quizzes for free by uploading documents