A graph of the force on an object as a function of its position is shown in the figure. Determine the amount of work done by this force on the object during a displacement from x = -2.00 m to x = 2.00 m. (Assume an accuracy of 3 significant figures for the numbers on the graph.) 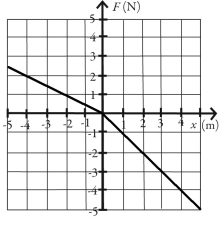
A) -12.0 J
B) -3.00 J
C) -1.00 J
D) 12.0 J
E) 3.00 J
Correct Answer:
Verified
Q35: In the figure, a 900-kg crate is
Q36: A constant horizontal pull acts on a
Q37: A spring stretches by 21.0 cm when
Q38: A ball is thrown upward at an
Q39: A person pushes horizontally on a heavy
Q41: You slam on the brakes of your
Q42: In the figure, two boxes, each of
Q43: A child pulls on a wagon with
Q45: A 7.0-kg rock is subject to a
Q47: A 4.00-kg mass is attached to a
Unlock this Answer For Free Now!
View this answer and more for free by performing one of the following actions

Scan the QR code to install the App and get 2 free unlocks

Unlock quizzes for free by uploading documents