You make a phospholipid bilayer with short, saturated hydrocarbon tails. You measure the permeability of this membrane to oxygen. You then double the length of the hydrocarbon tails and remeasure membrane permeability. You then double the length of the hydrocarbon tails again and make a third measurement of membrane permeability. You graph membrane permeability as a function of hydrocarbon tail length. Which of the accompanying graphs best represents the data you expect?
A) 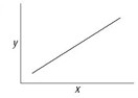
B) 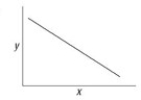
C) 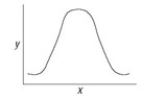
D) 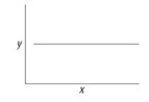
Correct Answer:
Verified
Q10: Which of the following is a large
Q11: Steroids are considered to be lipids because
Q12: Which of the following crosses lipid bilayers
Q13: Which aspect of phospholipids is most important
Q14: Which of the following increases the strength
Q16: You have a planar bilayer with equal
Q17: The presence of cholesterol in the plasma
Q18: What region of a steroid is hydrophilic?
A)
Q19: You make a phospholipid bilayer with short,
Q20: Which of the following crosses lipid bilayers
Unlock this Answer For Free Now!
View this answer and more for free by performing one of the following actions

Scan the QR code to install the App and get 2 free unlocks

Unlock quizzes for free by uploading documents