You make a phospholipid bilayer with short, saturated hydrocarbon tails. You measure the permeability of this membrane to oxygen. You are going to change the length of the hydrocarbon tails and remeasure membrane permeability, but first your boss asks you to graph the data you expect if there is no effect of hydrocarbon tail length on membrane permeability (your null hypothesis) . Which of the accompanying graphs best represents the data you expect if your null hypothesis is correct?
A) 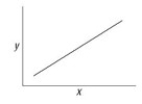
B) 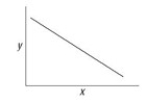
C) 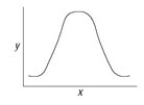
D) 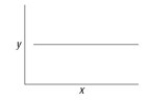
Correct Answer:
Verified
Q14: Which of the following increases the strength
Q15: You make a phospholipid bilayer with short,
Q16: You have a planar bilayer with equal
Q17: The presence of cholesterol in the plasma
Q18: What region of a steroid is hydrophilic?
A)
Q20: Which of the following crosses lipid bilayers
Q23: Celery stalks that are immersed in freshwater
Q24: Refer to the following paragraph and accompanying
Q67: Five dialysis bags, constructed from a semipermeable
Q78: Which of the following factors would tend
Unlock this Answer For Free Now!
View this answer and more for free by performing one of the following actions

Scan the QR code to install the App and get 2 free unlocks

Unlock quizzes for free by uploading documents