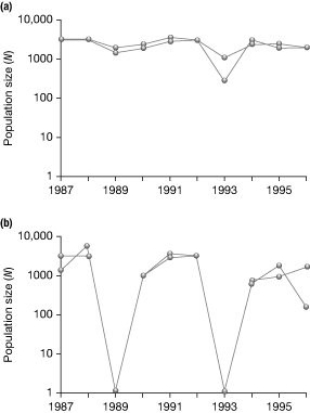
 Graph (b) in the accompanying figure shows the normal fluctuations of a population of grouse. Assuming graph (a) in the figure is the result of some experimental treatment in the grouse population, what can be concluded?
A) The experimental treatment exacerbated the population cycling.
B) The experimental treatment did not affect population cycling in this species.
C) The experimental treatment has most likely identified the cause of population cycling.
D) None of the other responses is true.
Correct Answer:
Verified
Q40: Imagine that you are managing a large
Q42: Q43: Which of the following could be a Q44: Q46: Conservationists will take snow geese off the Q48: What cannot be determined from examining age Q49: Use the following abstract from Theoretical Population Q50: It is estimated that a flock of Q51: Which statement is TRUE with regard to Q52: Unlock this Answer For Free Now! View this answer and more for free by performing one of the following actions Scan the QR code to install the App and get 2 free unlocks Unlock quizzes for free by uploading documents![]()
![]()
![]()

