The question(s) below refer to the following table, which compares the % sequence homology of four different parts (two introns and two exons) of a gene that is found in five different eukaryotic species. Each part is numbered to indicate its distance from the promoter (for example, Intron I is the one closest to the promoter) . The data reported for species A were obtained by comparing DNA from one member of species A to another member of species A.
-Based on the tabular data, and assuming that time advances vertically, which phylogenetic tree is the most likely depiction of the evolutionary relationships among these five species?
A) 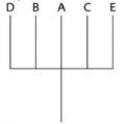
B) 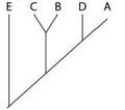
C) 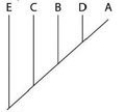
D) 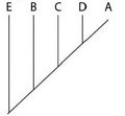
Correct Answer:
Verified
Q29: Some molecular data place the giant panda
Q30: Phylogenetic trees constructed from evidence from molecular
Q31: Which value(s) would be required to calculate
Q32: For many years, scientists believed that almost
Q36: Which of the following would be LEAST
Q38: If, someday, an Archaean cell is discovered
Q39: When using a cladistic approach to systematics,
Q46: Which statement represents the best explanation for
Q64: If you were using cladistics to build
Q69: The next questions refer to the following
Unlock this Answer For Free Now!
View this answer and more for free by performing one of the following actions

Scan the QR code to install the App and get 2 free unlocks

Unlock quizzes for free by uploading documents