Figure 3-G
The diagram below represents the market for butter. 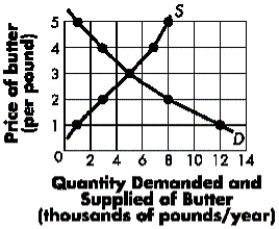
-Refer to Figure 3-G.If the current price of butter equals $2, you would expect to find:
A) the market in equilibrium at 3,000 pounds per year.
B) the market in equilibrium at 8,000 pounds per year.
C) that the market is not in equilibrium, and that the quantity supplied is greater than the quantity demanded.
D) that the market is not in equilibrium, and that the quantity demanded is greater than the quantity supplied.
Correct Answer:
Verified
Q2: Figure 3-H Q3: Table 3-D Q4: Figure 3-G Q5: Figure 3-G Q6: Figure 3-H Q8: Figure 3-H Q9: Table 3-D Q10: Figure 3-H Q11: Table 3-D Q12: Figure 3-H Unlock this Answer For Free Now! View this answer and more for free by performing one of the following actions Scan the QR code to install the App and get 2 free unlocks Unlock quizzes for free by uploading documents![]()
Use the following information about
The diagram below represents the market
The diagram below represents the market![]()
![]()
Use the following information about![]()
Use the following information about![]()

