Multiple Choice
Figure 3-A 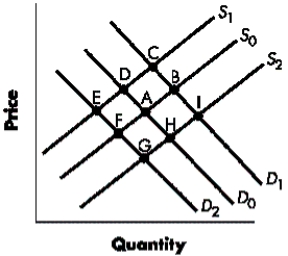
-Refer to Figure 3-I.Starting with initial demand curves D0 and S0, a movement from ____ is consistent with an increase in both demand and supply.
A) Point A to Point I
B) Point A to Point C
C) Point A to Point F
D) Point A to Point E
E) Point A to Point D
Correct Answer:
Verified
Related Questions
Q18: Table 3-D
Use the following information about
Q19: Figure 3-G
The diagram below represents the market
Q20: Table 3-D
Use the following information about

