Figure 3-A 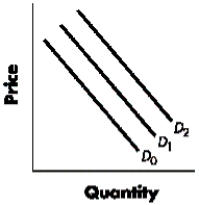
-Refer to Figure 3-A.Using the graph and beginning on D1, a shift to D0 would indicate a(n) :
A) increase in demand.
B) decrease in demand.
C) increase in quantity demanded.
D) decrease in quantity demanded.
E) increase in supply.
Correct Answer:
Verified
Q89: There is an increase in both consumer
Q111: Suppose there is a reduction in consumer
Q127: Ceteris paribus, if the market demand for
Q222: Figure 3-D Q224: Figure 3-D Q225: Figure 3-D Q228: Figure 3-B Q229: Cold weather in the Midwestern and eastern Q230: Technological progress increases the efficiency of mass Q232: Figure 3-A Unlock this Answer For Free Now! View this answer and more for free by performing one of the following actions Scan the QR code to install the App and get 2 free unlocks Unlock quizzes for free by uploading documents![]()
![]()
![]()
![]()
![]()

