Multiple Choice
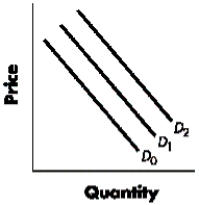
Figure 3-A 
-Refer to Figure 3-A.Using the graph and beginning on D1, a shift to D2 would indicate a(n) :
A) increase in demand.
B) decrease in demand.
C) increase in quantity demanded.
D) decrease in quantity demanded.
E) increase in supply.
Correct Answer:
Verified
Related Questions

