Refer to the following figure when answering
Figure 5.4: Solow Diagram 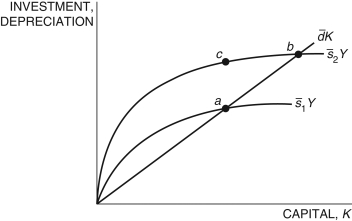
-Consider the Solow model exhibited in Figure 5.4.
Which of the following is/are true?
i. For any single country, the movement from point a to b is due to an increase in the saving rate, s1 > s2.
ii. For any single country, the movement from point c to b is due to an increase in capital stock for the saving rate, s2.
iii. If s1 and s2 stands for the saving rates in Countries 1 and 2, respectively, Country 2 has a lower saving rate.
A) i
B) ii
C) iii
D) i and ii
E) i, ii, and iii
Correct Answer:
Verified
Q68: If we define
Q69: The key difference between the Solow model
Q69: Which of the following best answers whether
Q70: If the depreciation and saving rates are
Q71: An implication of the Solow model is
Q73: If we define
Q74: In the Solow model, saving and investing
Q75: In the Solow model, with population growth:
A)
Q76: A decline in the savings rate causes:
A)
Q77: Assume two economies are identical in every
Unlock this Answer For Free Now!
View this answer and more for free by performing one of the following actions

Scan the QR code to install the App and get 2 free unlocks

Unlock quizzes for free by uploading documents