Figure 5.8: Economic Growth Rates in France, Germany, and Japan 1951-2010 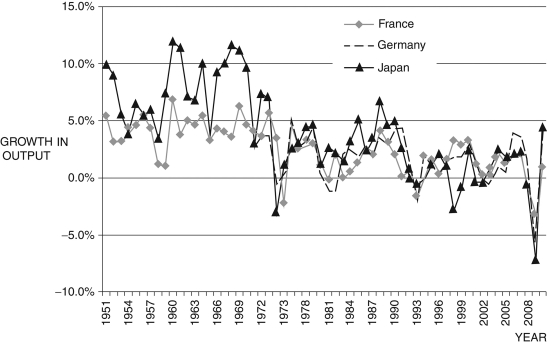
(Source: Federal Reserve Economic Data, St. Louis Federal Reserve)
-Consider the data in Figure 5.8, which shows the growth rates for three countries that were involved in World War II. How does the basic Solow model explain the trends in growth rates for each of these countries?
Correct Answer:
Verified
View Answer
Unlock this answer now
Get Access to more Verified Answers free of charge
Q105: The Solow model assumes the saving rate
Q108: In the steady state, gross investment is
Q112: The key difference between the Solow and
Q114: In the steady state, output per person
Q115: If we define the saving rate
Q118: In the steady state, capital accumulation is
Q121: Given a production function
Q122: You are asked to make comparisons of
Q123: Show the transition dynamics in the
Q124: Suppose that rather than the Cobb-Douglas
Unlock this Answer For Free Now!
View this answer and more for free by performing one of the following actions

Scan the QR code to install the App and get 2 free unlocks

Unlock quizzes for free by uploading documents