Figure 17.5: Investment-Output Ratio 2005-2012 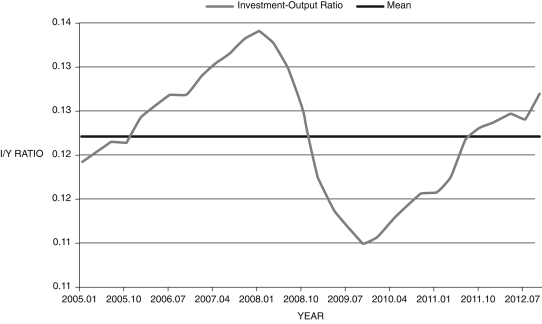
(Source: Federal Reserve Economic Data, St. Louis Federal Reserve)
-Figure 17.5 shows the quarterly investment-output ratio (It/Yt) for 2005-2012. Use the discussion on desired capital to investment, and what you know about the Great Recession, to motivate a discussion about the decline in investment that began in the mid-2000s.
Correct Answer:
Verified
View Answer
Unlock this answer now
Get Access to more Verified Answers free of charge
Q102: Consider Figure 17.9 below. As can be
Q104: See Figure 17.6 below.
Also, as 
Q108: From the residential arbitrage equation, a rise
Q109: Figure 17.4: Capital Arbitrage Q110: When Tobin's q is equal to zero, Q111: If a stock is just as likely Q112: Nonresidential fixed investment, residential fixed investment, and Q114: Tobin's q is the ratio of stock Q115: Figure 17.7: Price-Earnings Ratio: 1985-2012 Q116: Figure 17.8: Weekly Percent Change in Apple![]()
Unlock this Answer For Free Now!
View this answer and more for free by performing one of the following actions

Scan the QR code to install the App and get 2 free unlocks

Unlock quizzes for free by uploading documents