The graph below shows the supply and demand curves for dollars in the pound/dollar market. 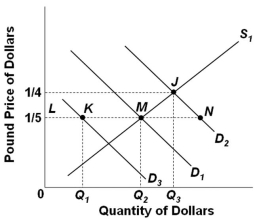 Refer to the graph above. Assume that D1 and S1 are the initial demand for and supply of dollars. The exchange rate will be:
A) $5 equals 1 pound
B) $4 equals 1 pound
C) $1 equals 5 pounds
D) $0.20 equals 1 pound
Correct Answer:
Verified
Q83: The graph below shows the supply and
Q84: According to the purchasing power parity theory,
Q85: Which of the following would tend to
Q86: The graph below shows the supply and
Q87: Assume that U.S. and European governments adopt
Q89: Which is not a serious disadvantage associated
Q90: Assume that Japan and the United States
Q91: With flexible exchange rates, an increase in
Q92: Fixed exchange rates are often maintained by
Q93: Assume that Japan and the United States
Unlock this Answer For Free Now!
View this answer and more for free by performing one of the following actions

Scan the QR code to install the App and get 2 free unlocks

Unlock quizzes for free by uploading documents