Multiple Choice
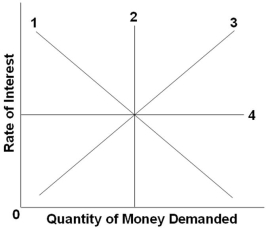 Which line in the graph above would best illustrate the transactions demand for money curve?
A) Line 1
B) Line 2
C) Line 3
D) Line 4
Correct Answer:
Verified
Related Questions
Q2: A decrease in the interest rate will
Q3: A consumer holds money to meet spending
Q4: The transactions demand for money will shift
Q5: Q6: If nominal GDP is $4,000 billion and Q8: If the dollars held for transactions purposes Unlock this Answer For Free Now! View this answer and more for free by performing one of the following actions Scan the QR code to install the App and get 2 free unlocks Unlock quizzes for free by uploading documents![]()

