Multiple Choice
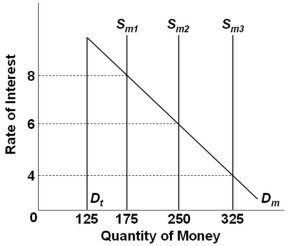 Refer to the graph above, in which Dt is the transactions demand for money, Dm is the total demand for money, and Sm is the supply of money. The market is in equilibrium at the 6 percent rate of interest. If the money supply then decreases as shown, the transaction demand for money will change by:
A) $175
B) $125
C) $75
D) $0
Correct Answer:
Verified
Related Questions
Q2: A decrease in the interest rate will
Q3: A consumer holds money to meet spending
Q4: The transactions demand for money will shift
Q6: If nominal GDP is $4,000 billion and

