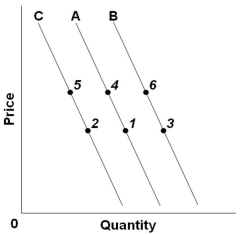
 Refer to the above graph with three demand curves. A "decrease in demand" would be illustrated as a change from:
A) Point 1 to point 4
B) Point 1 to point 3
C) Line C to B
D) Line A to C
Correct Answer:
Verified
Q26: Which would be a likely cause of
Q27: Use the following graph of the demand
Q28: For most products, purchases tend to fall
Q29: Q30: Which of the following would best be Q32: Which of the following will not cause Q33: Which of the following goods would most Q34: If product Y is an inferior good, Q35: An increase in the price of digital Q36: ![]()
![]()
Unlock this Answer For Free Now!
View this answer and more for free by performing one of the following actions

Scan the QR code to install the App and get 2 free unlocks

Unlock quizzes for free by uploading documents