Use the following graph of the demand for coffee: 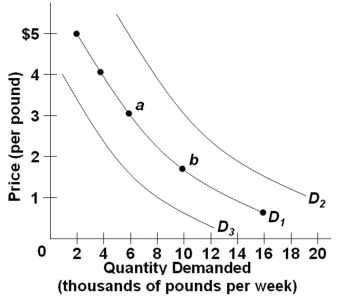 Refer to the above diagram of three demand curves for coffee. Which of the following would cause a shift in coffee demand from D1 to D2?
A) A decrease in the price of tea
B) An increase in consumer incomes
C) An increase in the prices of cream and sugar
D) A decrease in the price of coffee
Correct Answer:
Verified
Q22: Suppose that goods A and B are
Q23: Which of the following is not a
Q24: When economists say that the demand for
Q25: Which of the following factors is a
Q26: Which would be a likely cause of
Q28: For most products, purchases tend to fall
Unlock this Answer For Free Now!
View this answer and more for free by performing one of the following actions

Scan the QR code to install the App and get 2 free unlocks

Unlock quizzes for free by uploading documents