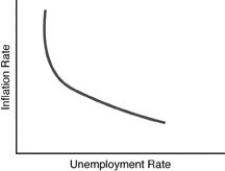
-Use the above figure. This graph is known as
A) the Laffer curve.
B) the short-run Phillips curve.
C) the NAIRU relationship.
D) the Keynesian curve.
Correct Answer:
Verified
Q109: Q110: Historical evidence suggests that Q111: Q112: An unexpected decrease in aggregate demand Q113: According to economists who support passive policymaking Q115: Unemployment that deviates from the natural rate Q116: The downward slope of the Phillips curve Q117: According to the Phillips curve Q118: Suppose the Fed permanently increases the money Q119: Unlock this Answer For Free Now! View this answer and more for free by performing one of the following actions Scan the QR code to install the App and get 2 free unlocks Unlock quizzes for free by uploading documents![]()
A) the Phillips curve![]()
A) causes
A)
A) there is![]()

