Multiple Choice
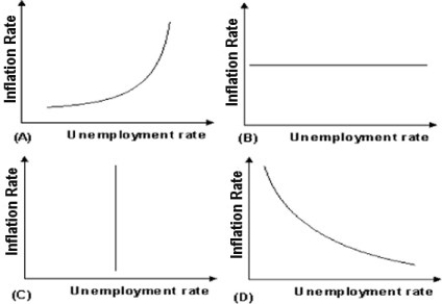
-Use the above figure. The long-run Phillips curve is best depicted by graph
A) A.
B) B.
C) C.
D) D.
Correct Answer:
Verified
Related Questions
Q104: Which of the following curves shows the
Q105: Q106: An unexpected increase in aggregate demand Q107: If households and businesses correctly anticipate the Q108: Q110: Historical evidence suggests that Q111: Q112: An unexpected decrease in aggregate demand Q113: According to economists who support passive policymaking Q114: Unlock this Answer For Free Now! View this answer and more for free by performing one of the following actions Scan the QR code to install the App and get 2 free unlocks Unlock quizzes for free by uploading documents![]()
A) causes![]()
A) the Phillips curve![]()
A) causes
A)![]()

