Multiple Choice
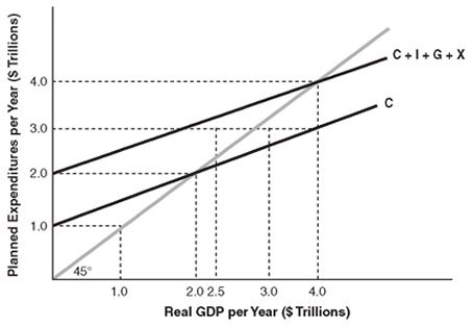
-In the above figure, the equilibrium level of real GDP per year is
A) $1.0 trillion.
B) $2.0 trillion.
C) $3.0 trillion.
D) $4.0 trillion.
Correct Answer:
Verified
Related Questions
Q361: Whenever total planned expenditures differ from real
Q362: Suppose that the marginal propensity to save
Q363: One divided by the marginal propensity to
Q364: Q365: Q367: In the Keynesian model with government and Q368: In equilibrium, real GDP is equal to Q369: Explain how the aggregate demand curve is Q370: Q371: Unlock this Answer For Free Now! View this answer and more for free by performing one of the following actions Scan the QR code to install the App and get 2 free unlocks Unlock quizzes for free by uploading documents![]()
![]()
A)![]()
![]()

