Multiple Choice
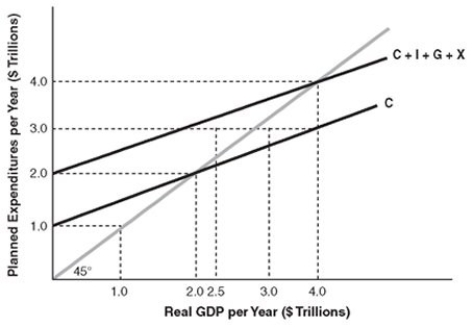
-In the above figure, at the equilibrium level of real GDP, there is
A) positive saving.
B) negative saving.
C) zero saving.
D) a negative tax rate.
Correct Answer:
Verified
Related Questions
Q366: Q367: In the Keynesian model with government and Q368: In equilibrium, real GDP is equal to Q369: Explain how the aggregate demand curve is![]()
A)

